How to Read a Balance Sheet Without Feeling Lost
Looking at a balance sheet, one of the key financial statements, for the first time can feel like staring at a map with no legend. Rows of numbers, unfamiliar labels, and one big question: what are you supposed to notice first?
The good news is that a balance sheet is simpler than it looks. It’s just a snapshot of financial position, showing what a business owns, what it owes, and the owner’s net worth. Once you know where to look, you can read balance sheet reports with a lot more calm and a lot less guessing.
Start With the Big Picture, Not the Tiny Numbers
A balance sheet, formally known as the statement of financial position, shows a company’s financial position at one point in time. Think of it like a photo, not a movie. It doesn’t tell the full story by itself, but it gives you a strong first impression.
Key idea: a balance sheet answers three things, what the business owns, what it owes, and what belongs to the owner after debts.
Key idea: a balance sheet answers three things, what the business owns, what it owes, and what belongs to the owner after debts.
The SEC’s balance sheet explainer uses the same foundation: the accounting equation assets = liabilities + equity. If that equation feels abstract, here’s the plain-English version.
This quick table makes the three parts easier to spot.
| Part | Plain-English meaning | Why it matters |
|---|---|---|
| Assets | What the business owns | Shows total assets, resources and cash strength |
| Liabilities | What the business owes | Shows bills, loans, and debt pressure |
| Equity | What’s left after debts | Shows the owner’s claim |
Total assets often appear in order of how quickly they turn into cash. Current assets can turn into cash within a year, such as cash, accounts receivable, and inventory. Accounts receivable means money customers owe the business. Inventory means goods the business still plans to sell. Long-term assets stick around longer, such as equipment, vehicles, or buildings.
Liabilities work the same way. Current liabilities are due within a year, like accounts payable, payroll, taxes, or short-term debt. Current liabilities create near-term obligations for the business. Long-term liabilities come due later, such as a multi-year loan.
Equity is the leftover piece. It represents owner’s equity or shareholder equity. If a business has $500,000 in total assets and $300,000 in liabilities, equity is $200,000. In other words, equity is the cushion.
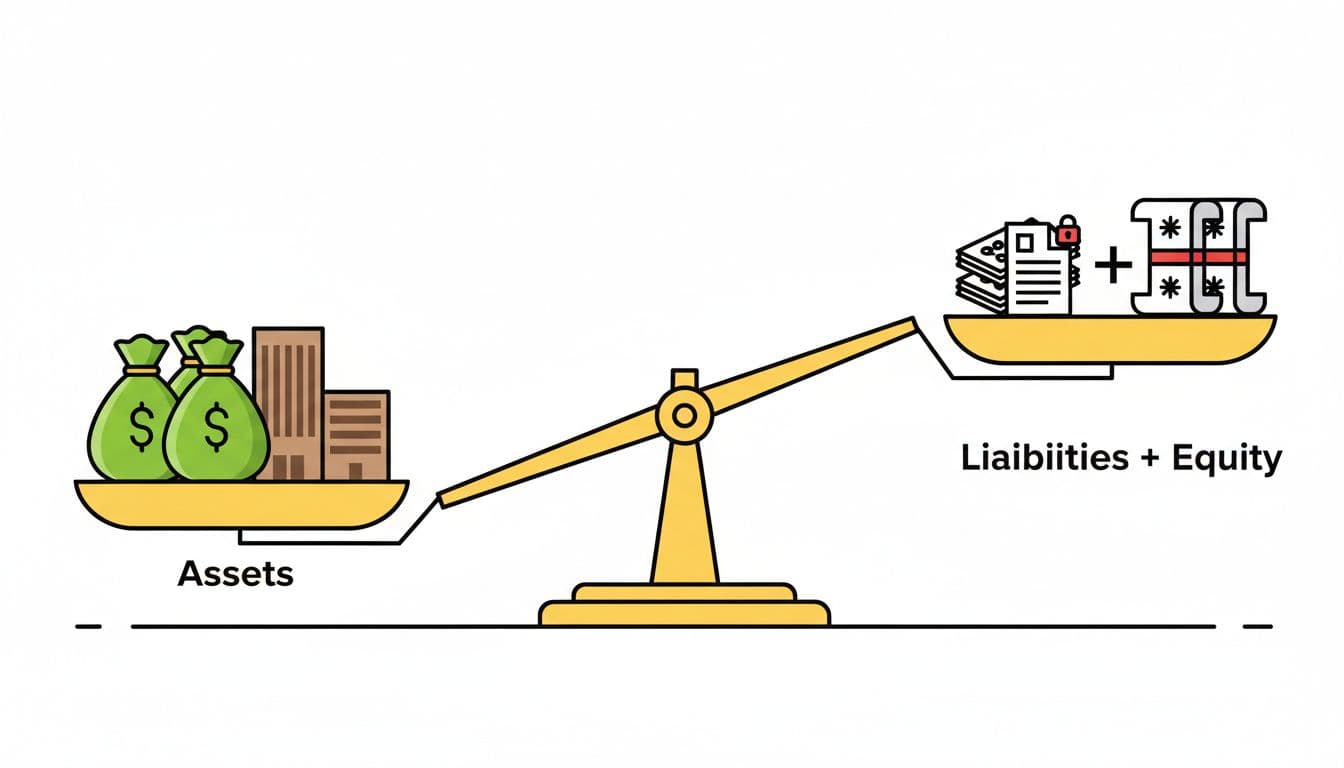
Once you see these three buckets, the report feels much less intimidating.
A Simple Framework to Read Any Balance Sheet
Don’t scan every line at once. Use the same order each time, and the page starts to make sense.

- Check the reporting date first: A balance sheet is only true for that reporting date. An old report can hide a current problem.
- Look at cash and near-cash assets: Cash is obvious. Accounts receivable means money customers owe the business. Inventory means goods not yet sold. These tell you how much short-term breathing room exists.
- Compare current assets to current liabilities: This is the quickest stress test for liquidity and working capital. If current assets are lower than current liabilities, the business may struggle to pay near-term bills. The current ratio helps here. Divide current assets by current liabilities. Around 1 or higher is usually safer than below 1, although it depends on the industry.
- Review total debt: Debt isn’t always bad. A healthy company can borrow to grow. Still, if loans rise while cash falls, or the debt-to-equity ratio worsens, pay attention.
- Read equity last: Growing equity, often through retained earnings, signals that the business has built value over time. Shrinking equity can point to losses, owner withdrawals, or too much debt.
Now add one comparison using horizontal analysis. Put this year beside last year, or this quarter beside the prior quarter. A single balance sheet is a snapshot. Two balance sheets start to show movement.
For public companies, the balance sheet makes more sense when you pair it with the SEC guide to reading a 10-K. The notes and management discussion often explain why debt rose, cash dropped, or inventory piled up.
For example, if cash fell from $80,000 to $25,000 while short-term debt rose from $20,000 to $70,000, that matters more than any one line by itself.
Balance Sheet Red Flags Beginners Should Notice
Red flags don’t always mean disaster. They do mean slow down and ask why.
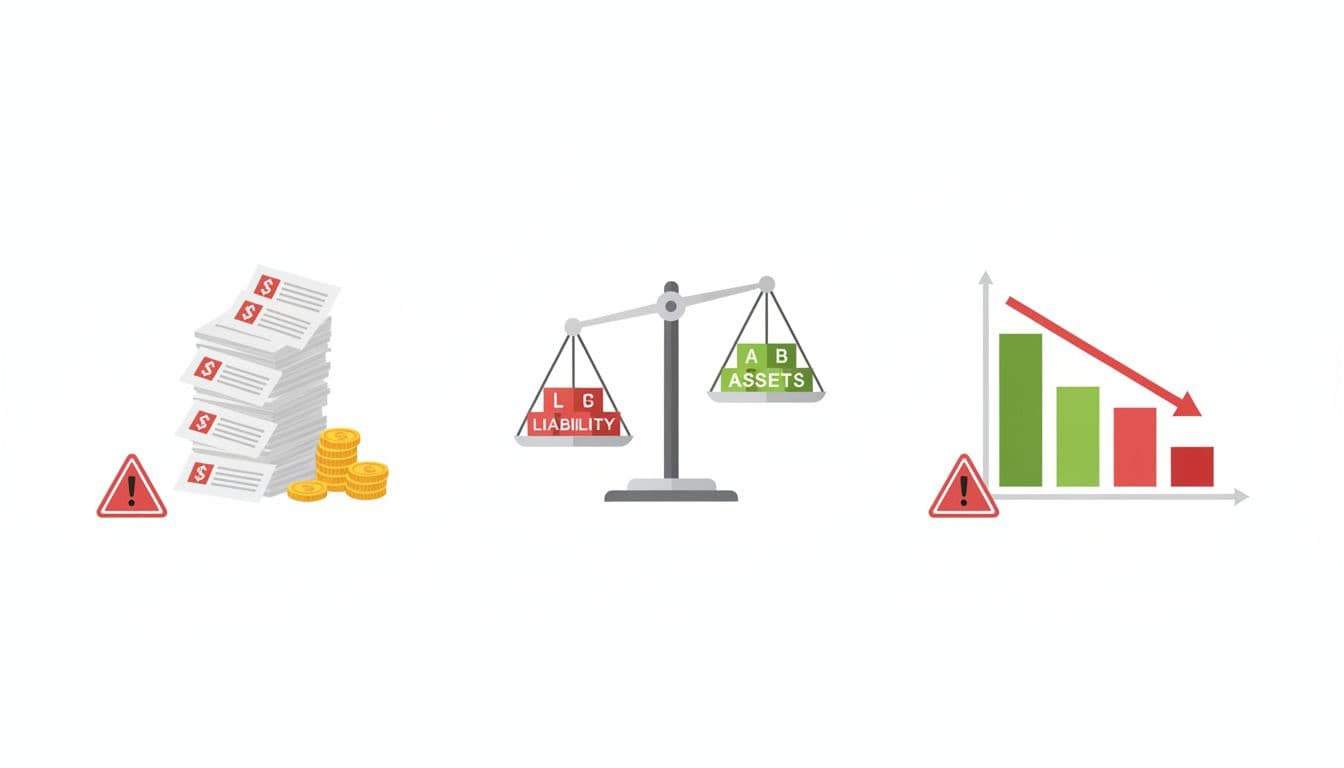
Here are the basics to watch:
- Too much debt: If liabilities grow much faster than assets or sales, the company may be leaning too hard on borrowing.
- Shrinking cash: Falling cash over several periods can signal stress, even if profit looks fine on paper.
- Weak current assets compared with current liabilities: This can point to trouble paying bills on time.
- Inventory rising too fast: Unsold products can tie up cash and may hint at slower sales.
- Receivables growing faster than revenue: Customers may be paying late, or revenue quality may be weak.
To get a full picture of solvency, cross-reference the balance sheet with the income statement and the cash flow statement. You can use vertical analysis (comparing line items to total assets) to spot trends in inventory or receivables more clearly.
One warning sign is manageable. Several at once deserve a closer look. That’s also why experienced investors read the notes, not just the front-page numbers. If you want a deeper look at warning signals, Investopedia’s article on creative accounting practices on balance sheets shows how presentation can sometimes look better than reality.
A strong balance sheet usually shows enough cash, manageable debt, and short-term assets that can cover short-term obligations.
A strong balance sheet usually shows enough cash, manageable debt, and short-term assets that can cover short-term obligations.
The Bottom Line
You don’t need an accounting degree to read balance sheet reports well. Start with assets, liabilities, and equity. Then compare cash, current assets, current liabilities, and debt. After that, look for changes over time.
The goal isn’t to memorize every term. It’s to spot whether the business looks stable, stretched, or improving. Using financial ratios makes the evaluation process more objective. Mastering how to read balance sheet reports is a key part of understanding all financial statements. Once you follow the same framework each time, the numbers stop feeling like noise and start telling a clear story.